Read the feedback report. Tap 'Show Questions' to answer the questions.
 | Survey responses to the pilot N.E. wear #1 & #2. |
1. The question was: What did you think of those advertisements?
| The survey result was |
| A | B |
 |
Those who said they didn't like the advertisements are furthest to the left, and those who liked it most are furthest on the right. The vertical bar shows where people were neutral. Dark colours mean more answers at this point.
A = men (orange) and women (blue) in ages 16-30. B = men (orange) and women (blue) of all ages.
2. The question was: Did you prefer advertisement #1 or advertisement #2?
The survey result was:
| Men 16 - 30 | Men of all ages | Women 16 - 30 | Women of all ages |
#1. 52% #2. 41%
No opinion. 7% |
#1. 47% #2. 34%
No opinion. 19% |
#1. 30% #2. 61%
No opinion. 9% |
#1. 28% #2. 40%
No opinion. 32% |
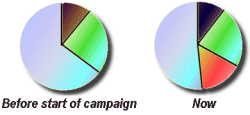
3. The question (to everyone) was: What brand of leisure clothing will your next purchase be?
The survey result was:

Dark Brown = Hapman
Pale Green = Ausweiss
Red = N.E. wear
Pale Blue = Others
4. The question (to men and women 16-30) was: Would you like your boyfriend/girlfriend to wear N.E. wear clothes?
The survey result was:
Men: 46% yes 12% no 42% don't care
Women: 61% yes 15% no 24% don't care
5. The question was: Why would you choose to buy N.E. wear?
The survey result was:
 | Green = quality
Blue = image
Red = style
Yellow = other
Purple = price |


